Netvisor Analytics: Secure the Network/Infrastructure
March 22, 2015 at 9:55 pm Leave a comment
We recently heard President Obama declare cyber security as one of his top priorities and we saw in recent time major corporations suffer tremendously from breaches and attacks. The most notable one is the breach at Anthem. For those who are still unaware, Anthem is the umbrella company that runs Blue Shield and Blue Cross Insurance as well. The attackers had access to people details, social security, home addresses, and email address for a period of month. What was taken and extent of the damage is still guesswork because network is a black hole that needs extensive tools to figure out what is happening or what happened. This also means the my family is impacted and since we use Blue Shield at Pluribus Networks, every employee and their family is also impacted prompting me to write this blog and a open invitation to the Anthem people and the government to pay attention to the new architecture that makes network play a role similar to NSA in helping protect the infrastructure. It all starts with converting the network from a black hole to something we can measure and monitor. To make this meaningful, lets look at state of the art today and why it is of no use and a step-by-step example on how Netvisor analytics help you see everything and take action on it.
Issues with existing networks and modern attack vector
In a typical datacenter or enterprise, the typical switches and routers are dumb packet switching devices. They switch billions of packets per second between servers and clients at sub micro second latencies using very fast ASICs but have no capability to record anything. As such, external optical TAPs and monitoring networks have to be built to get a sense of what is actually going on in the infrastructure. The figure below shows what monitoring today looks like: 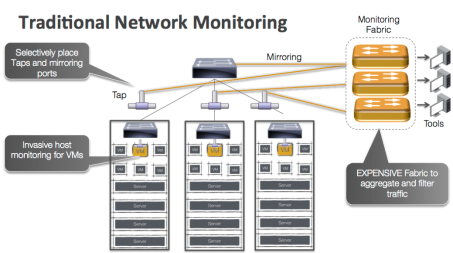
This is where the challenges start coming together. The typical enterprise and datacenter network that connects the servers is running at 10/40Gbps today and moving to 100Gbps tomorrow. These switches have typically 40-50 servers connected to them pumping traffic at 10Gbps. There are 3 possibilities to see everything that is going on:
- Provision a fiber optics tap at every link and divert a copy of every packet to the monitoring tools. Since the fiber optics tap and passive, you have to copy every packet and the monitoring tools need to deal with 500M to 1B packets per second from each switch. Assume a typical pod of 15-20 rack and 30-40 switches (who runs without HA), the monitoring tools need to deal with 15B to 40B packets per second. The monitoring Software has to look inside each packet and potentially keep state to understand what is going on which requires very complex software and amazing amount of hardware. For reference, a typical high-end dual socket server can get 15-40M packets into the system but has no CPU left to do anything else. We will need 1000 such servers plus associated monitoring network apart from monitoring software so we are looking at 15-20 racks of just monitoring equipment. Add the monitoring software and storage etc, the cost of monitoring 15-20 racks of servers is probably 100 times more then the servers itself.
- Selectively place fiber optic taps at uplinks or edge ports gets us back into inner network becoming a black hole and we have no visibility into what is going on. Key things we learnt from NSA and Homeland security is that a successful defense against attack requires extensive monitoring and you just can’t monitor the edge.
- Using the switch them selves to selectively mirror traffic to monitoring tools. A more popular approach these days but this is built of sampling where the sampling rates are typically 1 in 5000 to 10000 packets. Better then nothing but monitoring software has nowhere close to meaningful visibility and cost goes up exponentially as more switches get monitored (monitoring fabric needs more capacity, the monitoring software gets more complex and needs more hardware resources).
So what is wrong with just sampling and monitoring/securing the edge. The answer is pretty obvious. We do that today yet the break in keeps happening. There are many things contributing to it starting from the attack vector itself has shifted. Its not that employees in these companies have become careless but more to do with the myriad software and applications becoming prevalent in a enterprise or a datacenter. Just look at the amount of software and new applications that gets deployed everyday from so many sources and the increasing hardware capacity underneath. Any of these can get exploited to let the attackers in. Once the attackers has access to inside, the attack on actual critical servers and applications come from within. Lot of these platform and application goes home with employees at night where they are not protected by corporate firewalls and can easily upload data collected during the day (assuming the corporate firewall managed to block any connections). Every home is online today and most devices are constantly on network so attackers typically have easy access to devices at home and the same devices go to work behind the corporate firewalls.
Netvisor provides the distributed security/monitoring architecture
The goal of Netvisor is to make a switch programmable like a server. Netvisor leverages the new breed of Open Compute Switches by memory mapping the switch chip into the kernel over PCI-Express and taking advantage of powerful control processors, large amounts of memory, and storage built into the switch chassis. Figure below contrasts Netvisor on a Server-Switch using the current generation of switch chips with a traditional switch where the OS runs on a low powered control processor and low speed busses.
 Given that cheapest form of compute these days is a Intel Rangeley class processor with 8-16Gb memory, all the ODM switches are using that as a compute complex. Facebook’s Open Compute Program made this a standard allowing all modern switches to have a small server inside them that lays the foundation of our distributed analytics architecture on the switches without requiring any TAPs and separate monitoring network as shown in the Figure below.
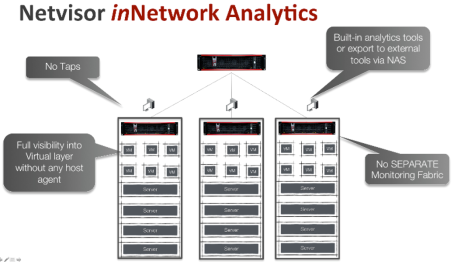 Each Server-Switch now becomes in network analytics engine along with doing layer 2 switching and layer 3 routing. Netvisor analytics architecture takes advantage of following:
- TCAM on switch chip that gives it the ability to identify a flow and take a copy of the packet (without impacting the timing of original packet) at zero cost (including TCP control packet and various network control packets)
- High performance, multi-threaded control plane over PCIe that can get 8-10Gbps of flow traffic into Netvisor kernel
- Intel Rangeley class CPU which is quad core and 8-16Gb of memory to process the flow traffic
So Netvisor can filter the appropriate packets in switch TCAM while switching 1.2 to 1.8Tbps of traffic at line rate and process millions of hardware filtered flows in software to keep state of millions of connection in switch memory. As such, each switch in the fabric becomes a network DVR or Time machine and records every application and VM flow it sees. With a Server-Switch with Intel Rangeley class processor, 16Gb of memory, each Netvisor instance is capable of tracking 8-10million application flows at any given time. These Server-Switches have a list price of under $20k from Pluribus Networks and are cheaper then your typical switch that just does dumb packet switching.
While the servers have to be connected to the network to provide service (you can’t just block all traffic to the servers), the Netvisor on switch can be configured to not allow any connections into it control plane (only access via monitors) or from selected client only and much easier to defend against attack and provide a uncompromised view of infrastructure that is not impacted even when servers get broken into.
Live Example of Netvisor Analytics (detect attack/take action via vflow)
The Analytics application on Netvisor is a Big Data application where each Server-Switch collects millions of records and when a user runs query from any instance, the data is collected from
Each Server-Switch and presented in coherent manner. The user has full scripting support along with REST, C, and Java APIs to extract the information in whatever format he wants and exports it to any application for further analysis.
We can look at some live example form Pluribus Networks internal network that uses Netvisor based fabric to meet all its network, analytics, security and services needs. The fabric consists of following switches
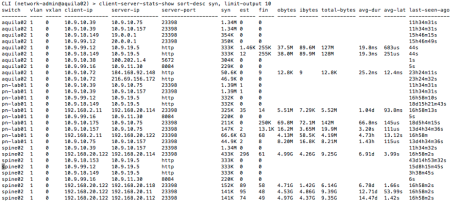
To look at top 10 client-server pair based on highest rate of TCP SYN is available using following query
Seems like IP address 10.9.10.39 is literally DDOS’ing server 10.9.10.75. That is very interesting. But before digging into that, lets look at which client-server pairs are most active at the moment. So instead of sorting on SYN, we sort on EST (for established) and limit the output to top 10 entries per switch (keep in mind each switch has millions of records that goes back days and months.
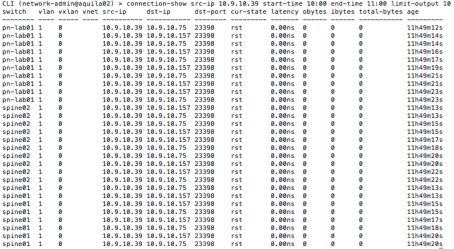
It appears that IP address which had a very high SYN rate do not show up in established list at all. Since the failed SYN showed up approx. 11h ago (around 10.30am today morning) so lets look at all the connection with src-ip being 10.9.10.39
This shows that not a single connection was successfully established. For sanity sake, lets look at the top connections in terms of total bytes during the same period
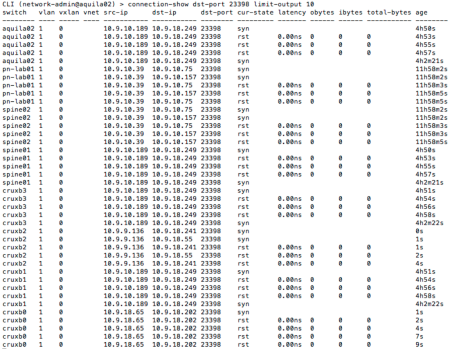
So the mystery deepens. The dst-port in question was 23398 which is not a well known port. So lets look at the same connection signature. Easiest is to look at all connections with destination port 23398.
It appears that multiple clients have the same signature. Obviously we dig in deeper without limiting any output and look at this from many angles. After some investigation, it appears that this is not a legitimate application and no developer in Pluribus owns these particular IP addresses. Our port analytics showed that these IP belong to Virtual Machines that were all created few days back around same time. The prudent thing is to block this port all together across entire fabric quickly using the vflow API
![]() It is worth noting that we used the scope fabric to create this flow with action drop to block it across the entire network (on every switch). We could have used a different flow action to look at this flow live or record all traffic matching this flow across the network.
It is worth noting that we used the scope fabric to create this flow with action drop to block it across the entire network (on every switch). We could have used a different flow action to look at this flow live or record all traffic matching this flow across the network.
Outlier Analysis
Given that Netvisor Analytics is not statistical sample and accurately represent every single session between the servers and/or Virtual Machines, most customer have some form of scripting and logging mechanism that they deploy to collect this information. The example below shows the information person is really interested in by selecting the columns he wants to see
 The same command is run from a cron job every night at mid night via a script with a parse able delimiter of choice that gets recorded in flat files and moved to different location.
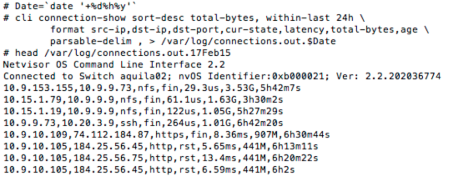 Another script can actually record all destination IP address and sort them and compares them from the previous day to see which new IP address showed up in outbound list and similarly for inbound list. The IP addresses where both source and destination were local are ignored but IP addresses where either is outside and fed into other tool which keep track of quality of the IP address against attacker databases. Anything suspicious is flagged immediately. Similar scripts are used for compliance to ensure there was no attempt to connect outside of legal services or servers didn’t issue outbound connection to employees laptops (to detect malware).
Summary
More investigations later showed that we didn’t had a intruder in our live example but one of the developer had created bunch of virtual machines cloning some disk image which had this application which was misbehaving. Still unclear where it found the server ip address from but things like this and actual attacks have happened in past at Pluribus Networks and Netvisor analytics helps us track and take action. The network is not a black hole but shows the weakness of our application running on servers and virtual machines.
The description of scripts in outlier analysis is deliberately vague since it relates to a customer security procedure but are building more sophisticated analysis engines to detect anomalies in real time against normal behavior.
Entry filed under: Netvisor. Tags: Netvisor, Network OS, Network Security, Pluribus Networks Netvisor, Switch Analytics, Virtual Switch.



Trackback this post | Subscribe to the comments via RSS Feed